
REQUEST A DEMO
Thank you! Your submission has been received!
Oops! Something went wrong while submitting the form.

We've been having a ton of fun with our new Analytics Engine, and we wanted to run through a quick use-case based on some interesting threat hunting pivots using Digital Risk Protection data. This is just one example of how we can support proactive risk identification and understanding what threats are relevant to you and how to best mitigate them.
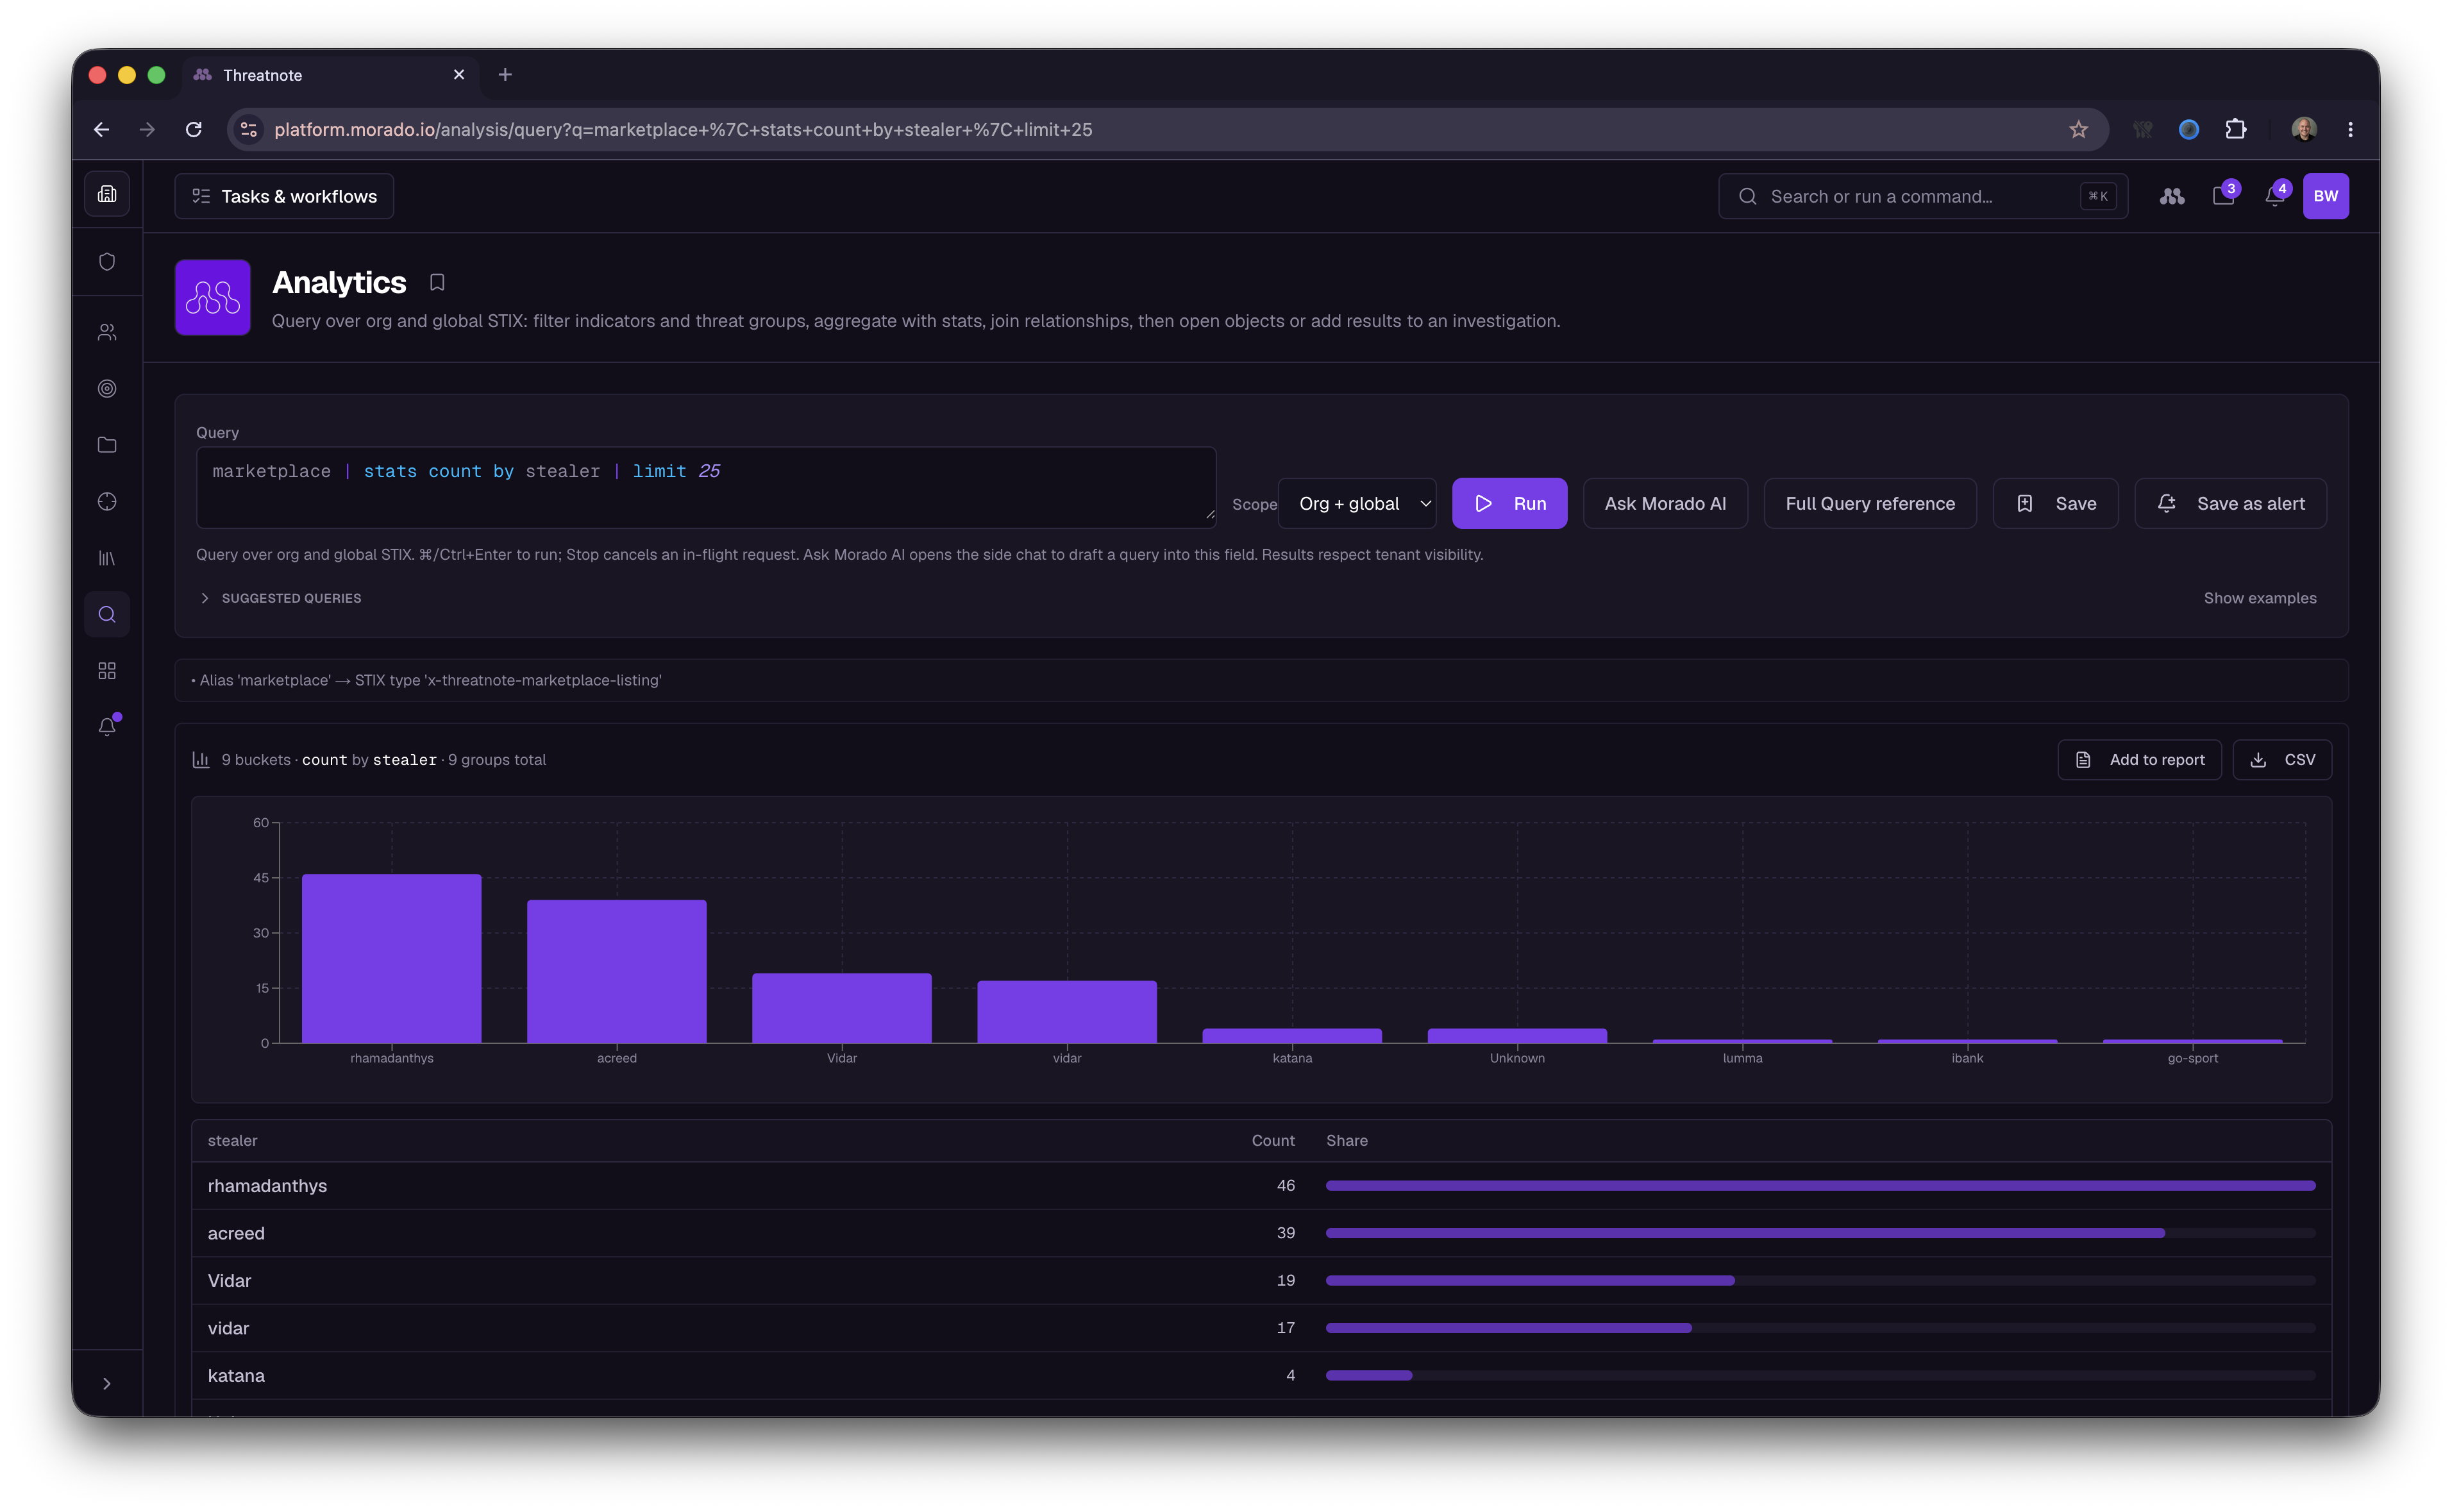
Let’s start with checking out the most active stealer malware that is impacting our users. Here you can see an example lift pulling in all recent marketplace listings (marketplace) for domains you are monitoring, and we are performing a quick count by unique stealer malware (| stats count by stealer ).
Looks like Rhamadanthys is the most active, with acreed and Vidar following behind them.
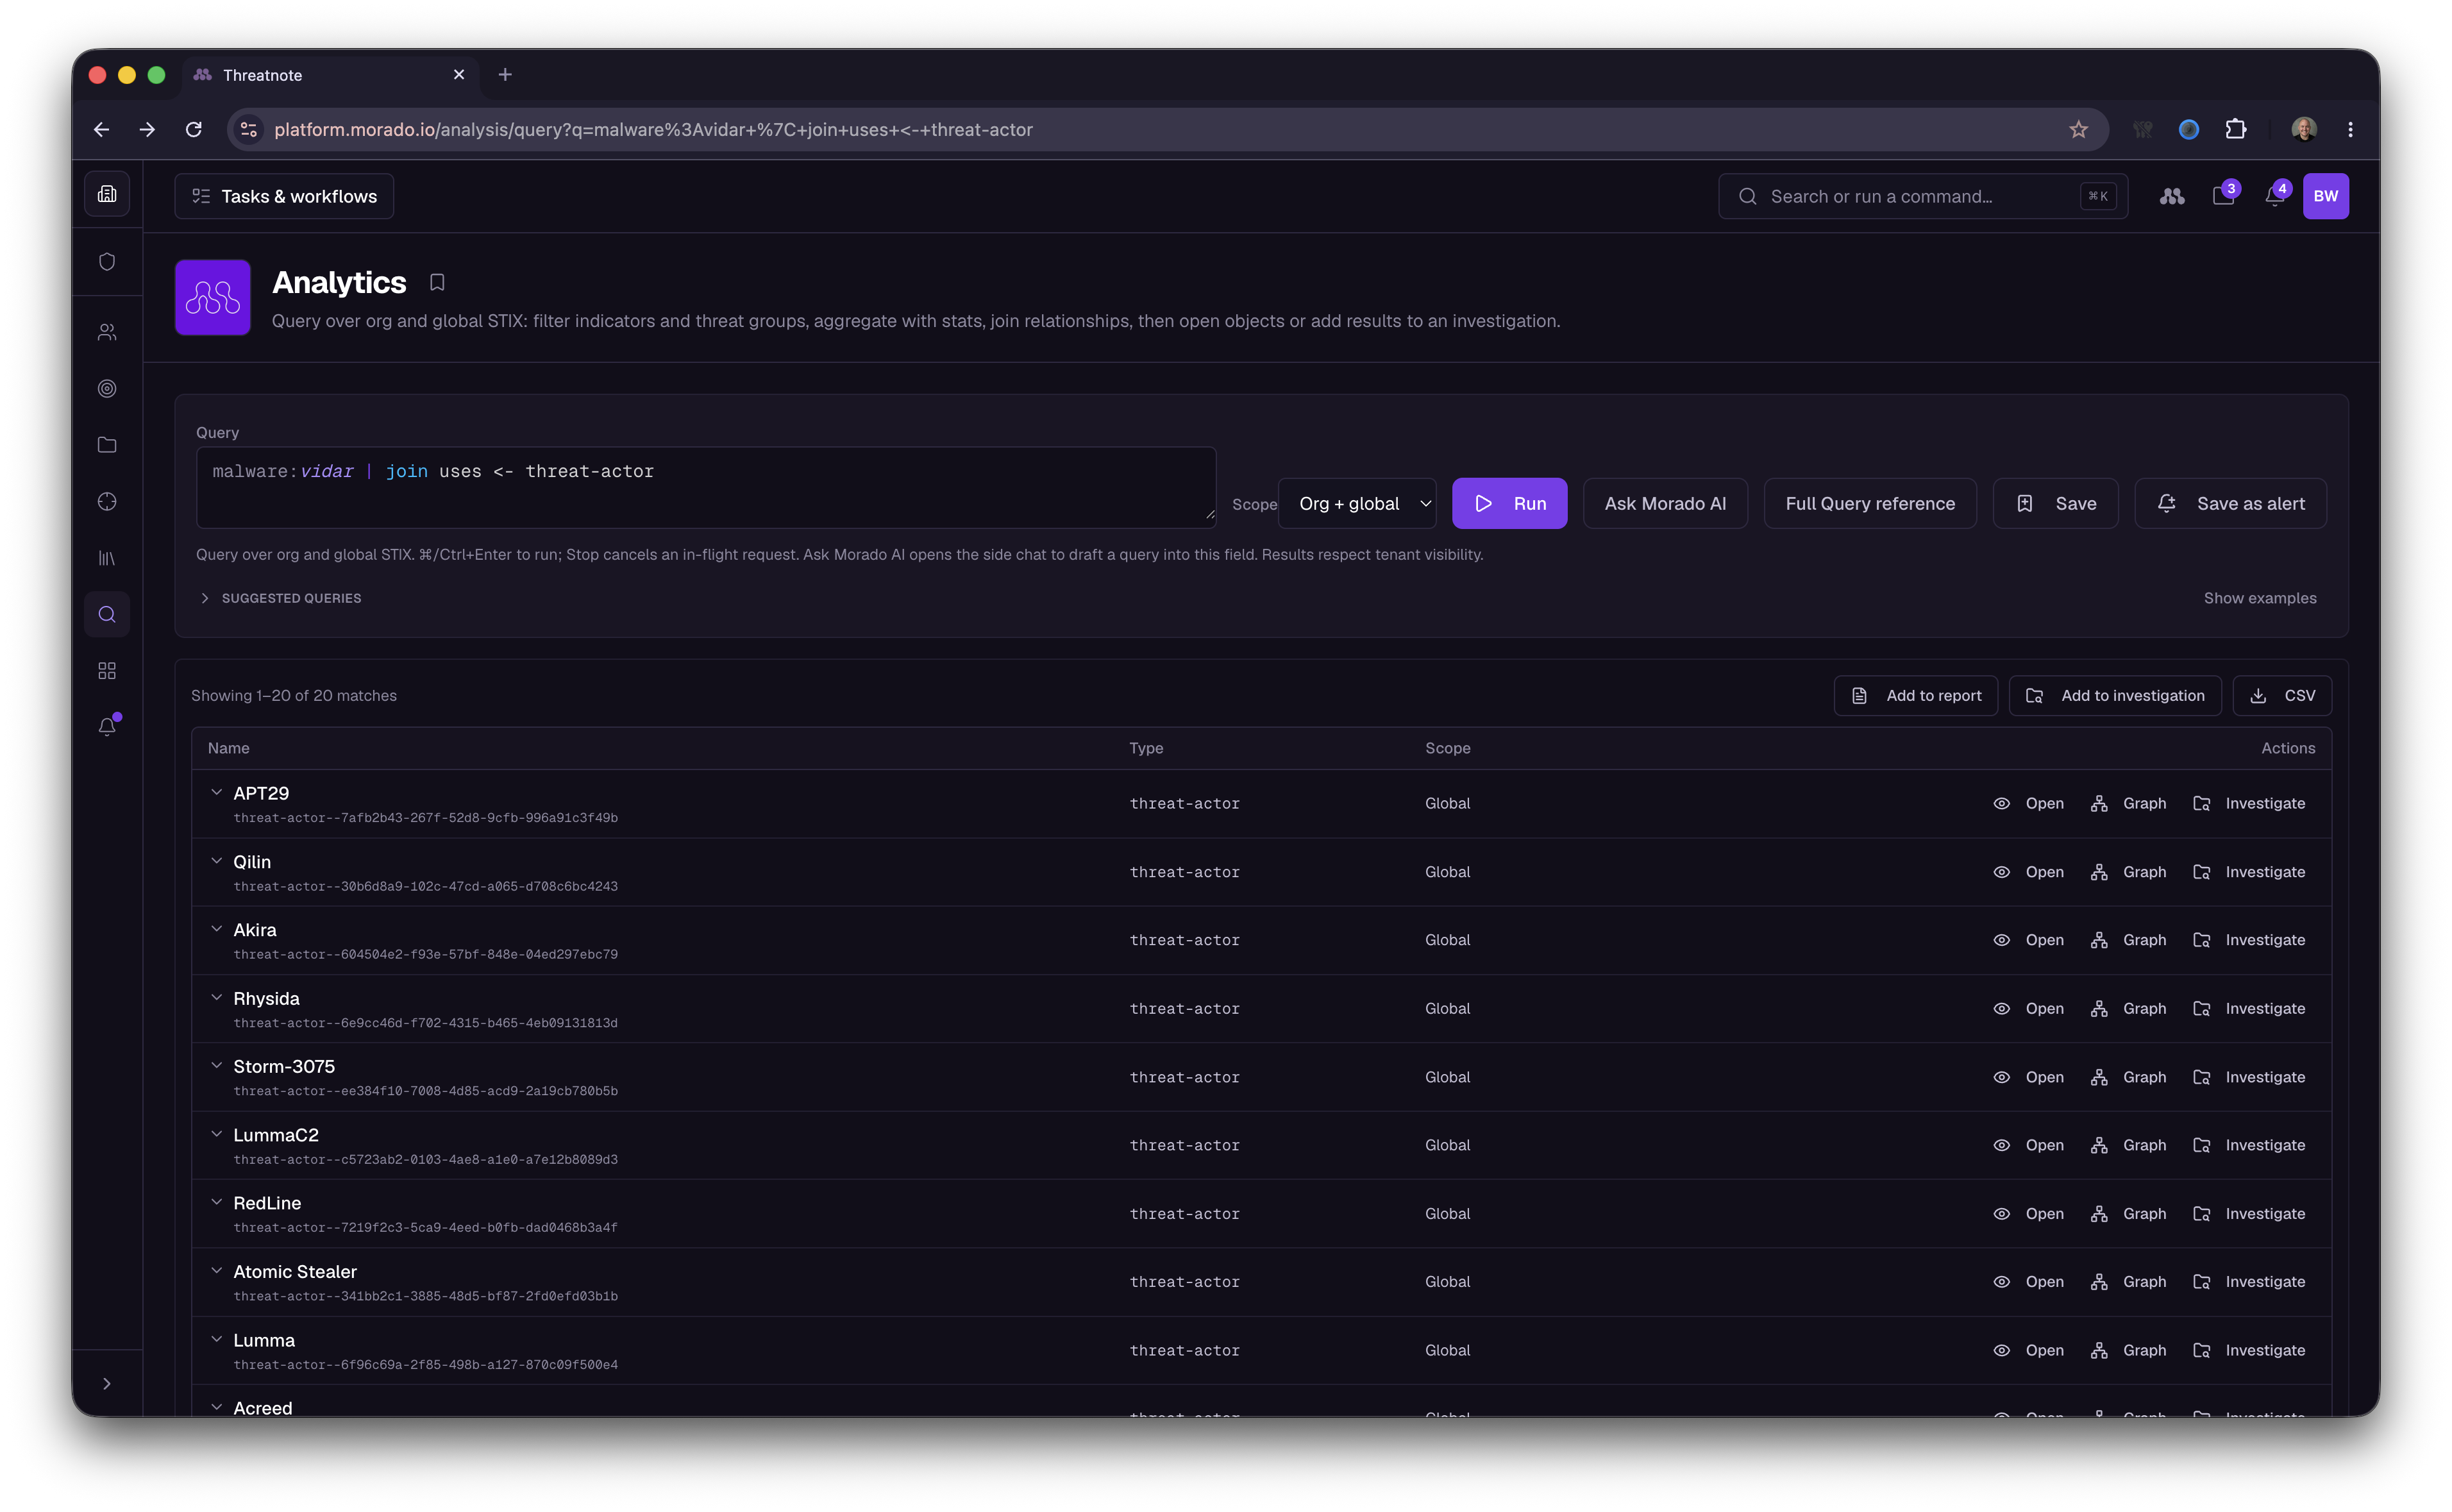
Vidar has been popping up a lot recently, so let’s check them out a little more. Here we are lifting in the Vidar malware object (malware:vidar), then joining that dataset with the threat actors that have been associated with that particular malware (join uses <- threat-actor ).
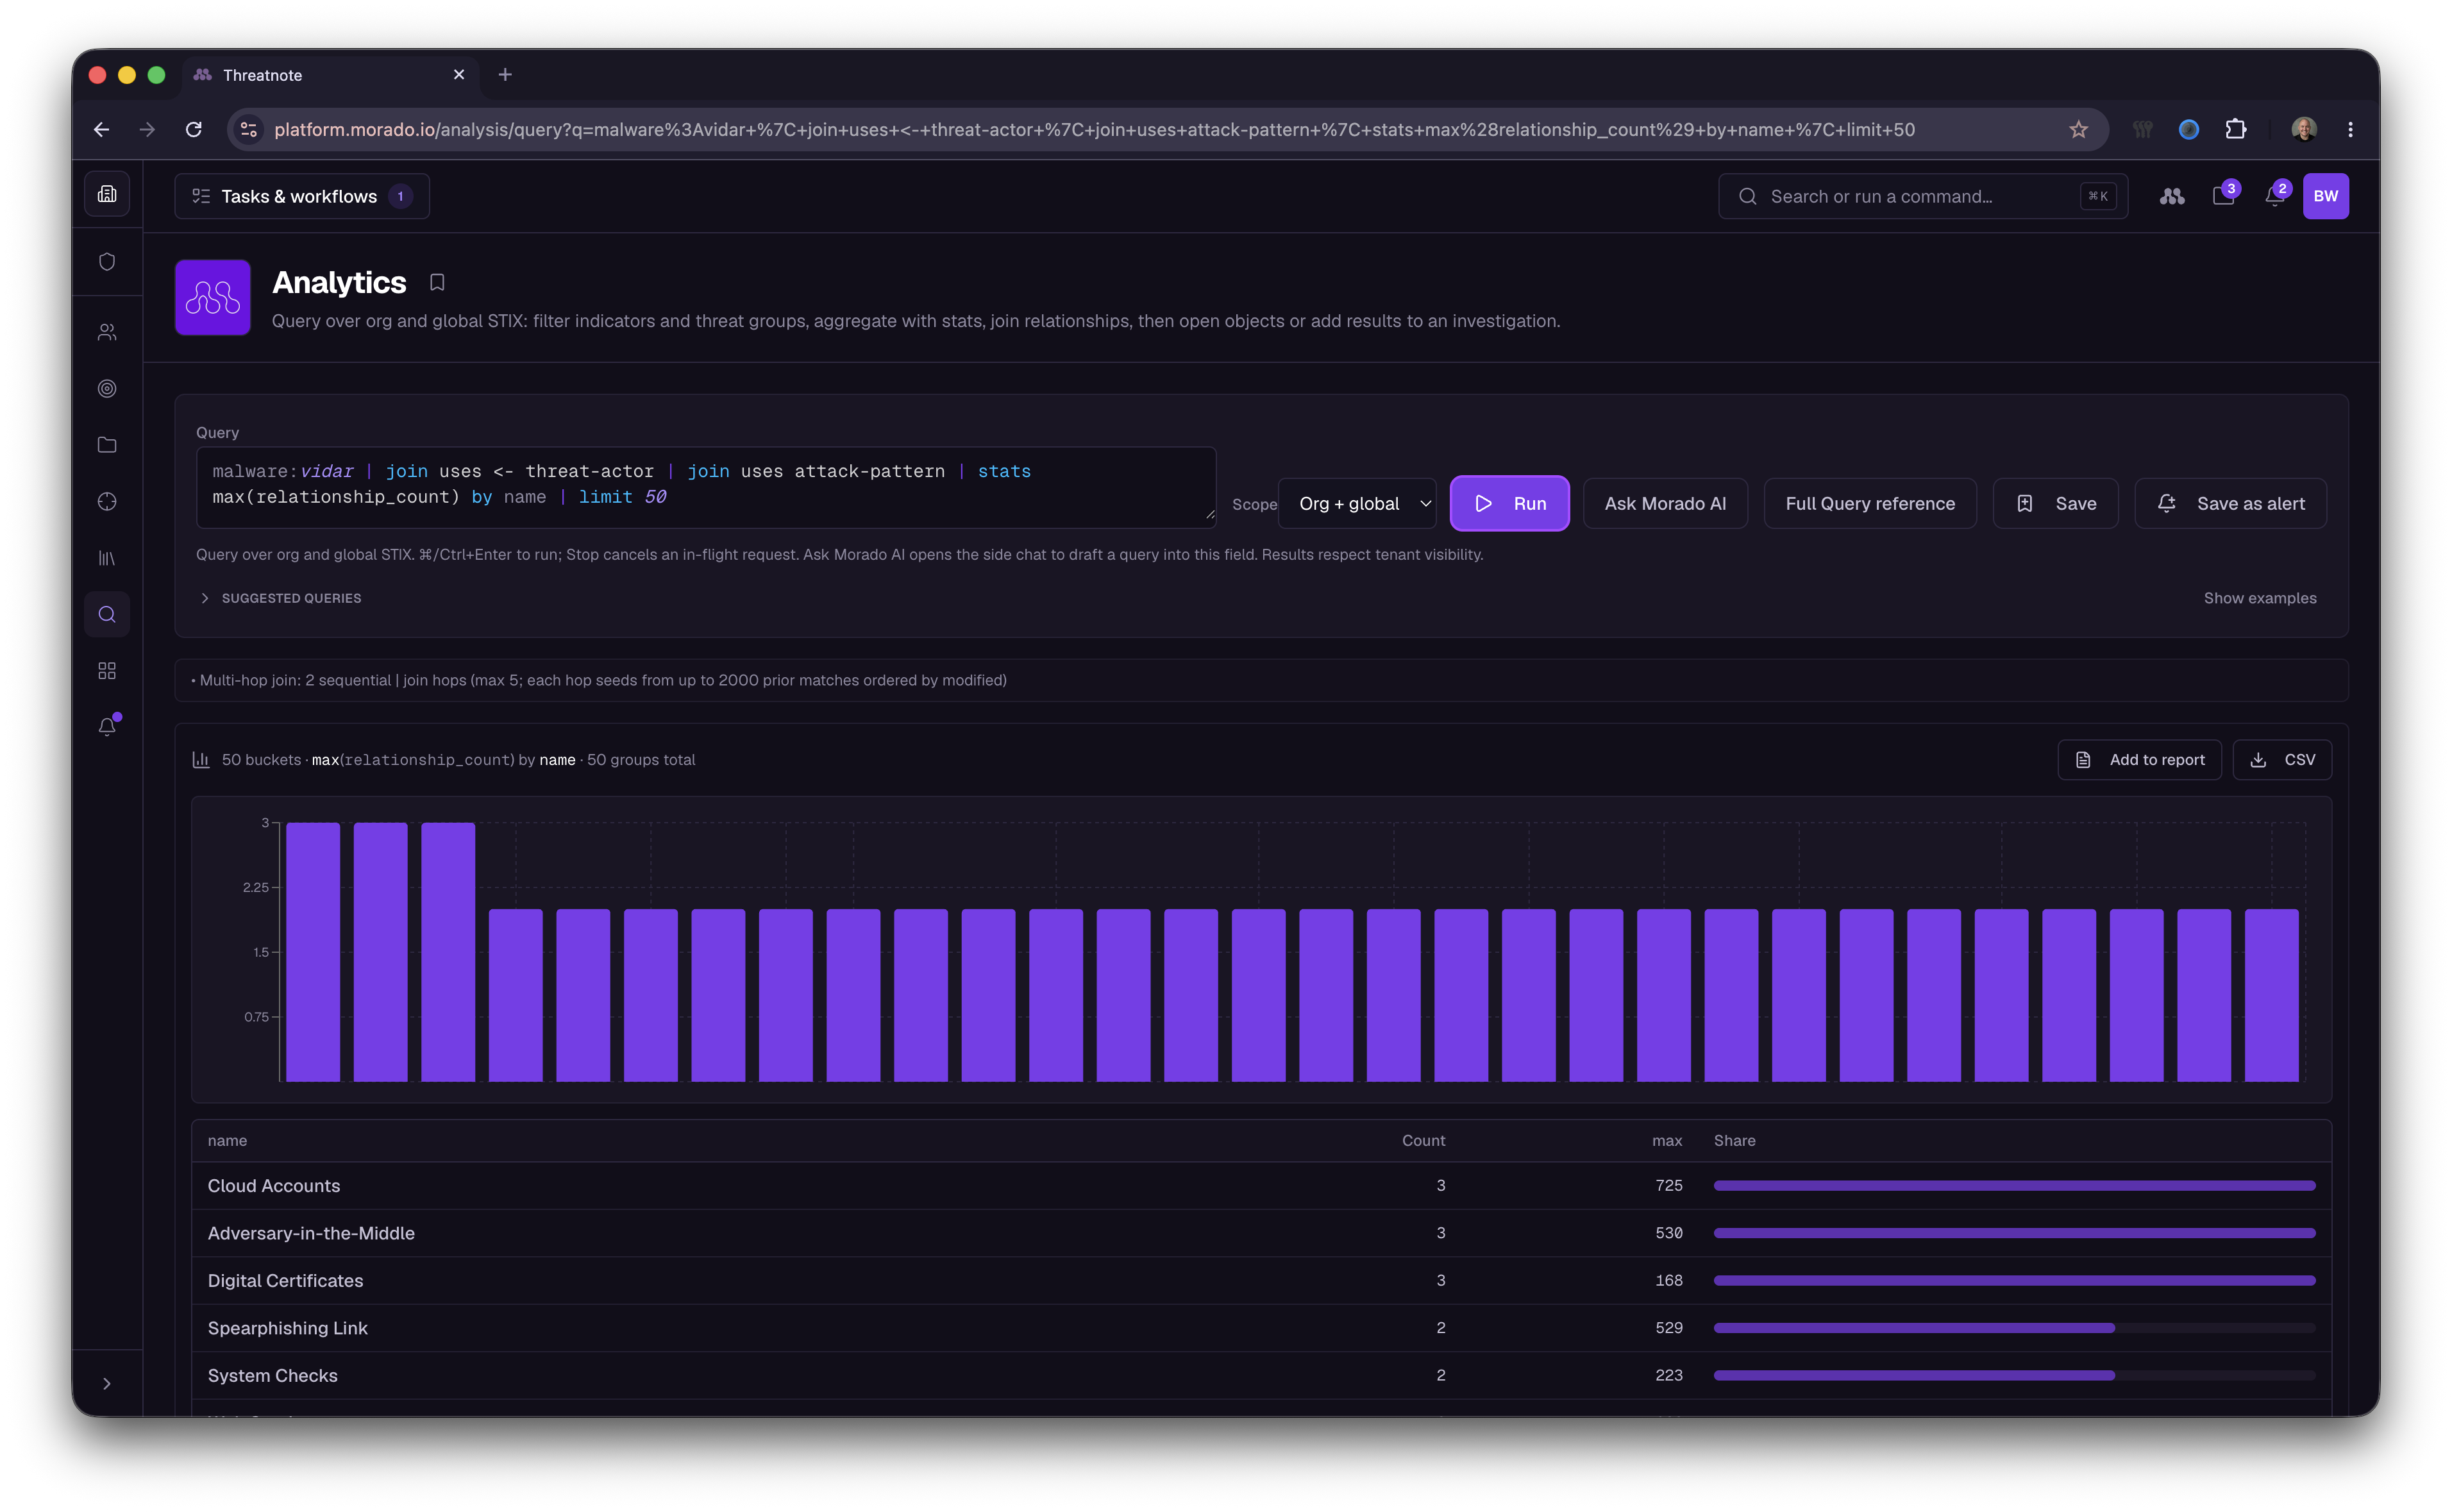
Alright, well, we know we’ve been getting hit by Vidar a lot recently, how are these groups actually infecting our machines? We can extrapolate their TTP’s observed, by then joining those threat groups with their associated TTP’s as seen below. We are interested in our gaps and identifying how they are still infecting us, so we can add the pipe | where coverage:none, which filters the results to only showing TTP’s we have no detection coverage for (detection signatures or deployed security tooling).
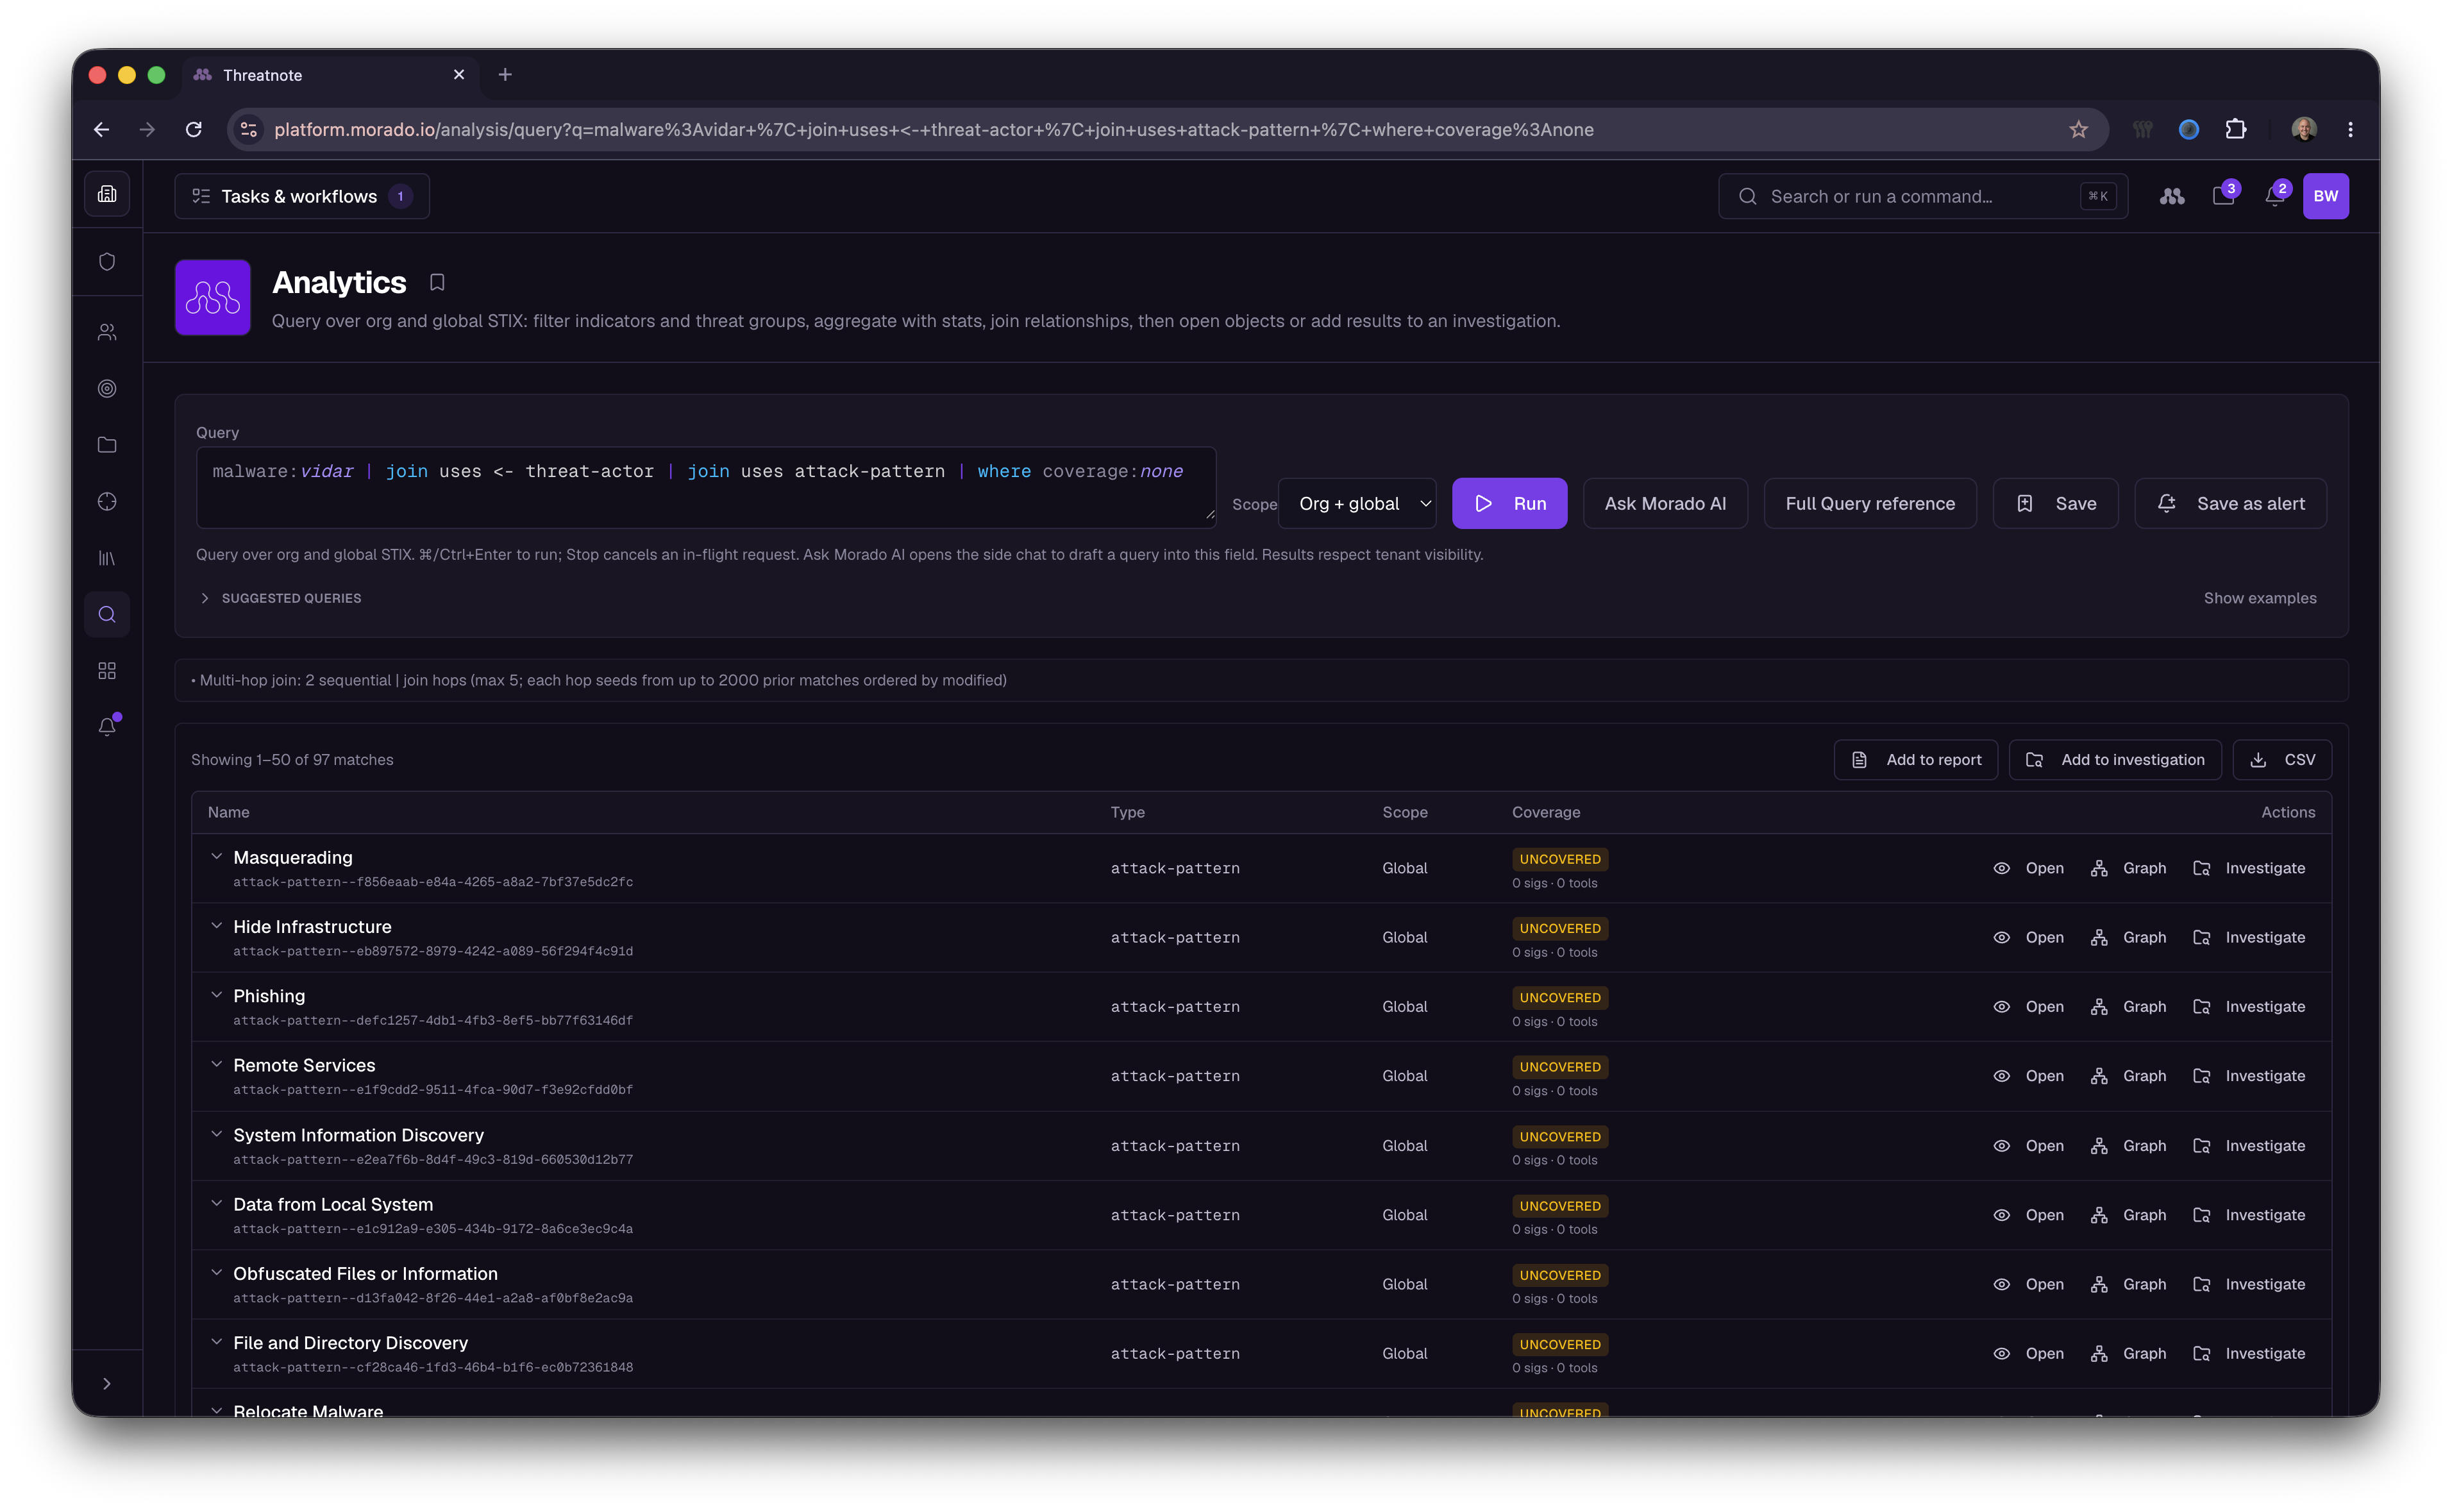
We can slice things a few different ways here to help us prioritize what we are trying to accomplish, we can view how active these TTP’s are, and prioritize by most active TTP’s:
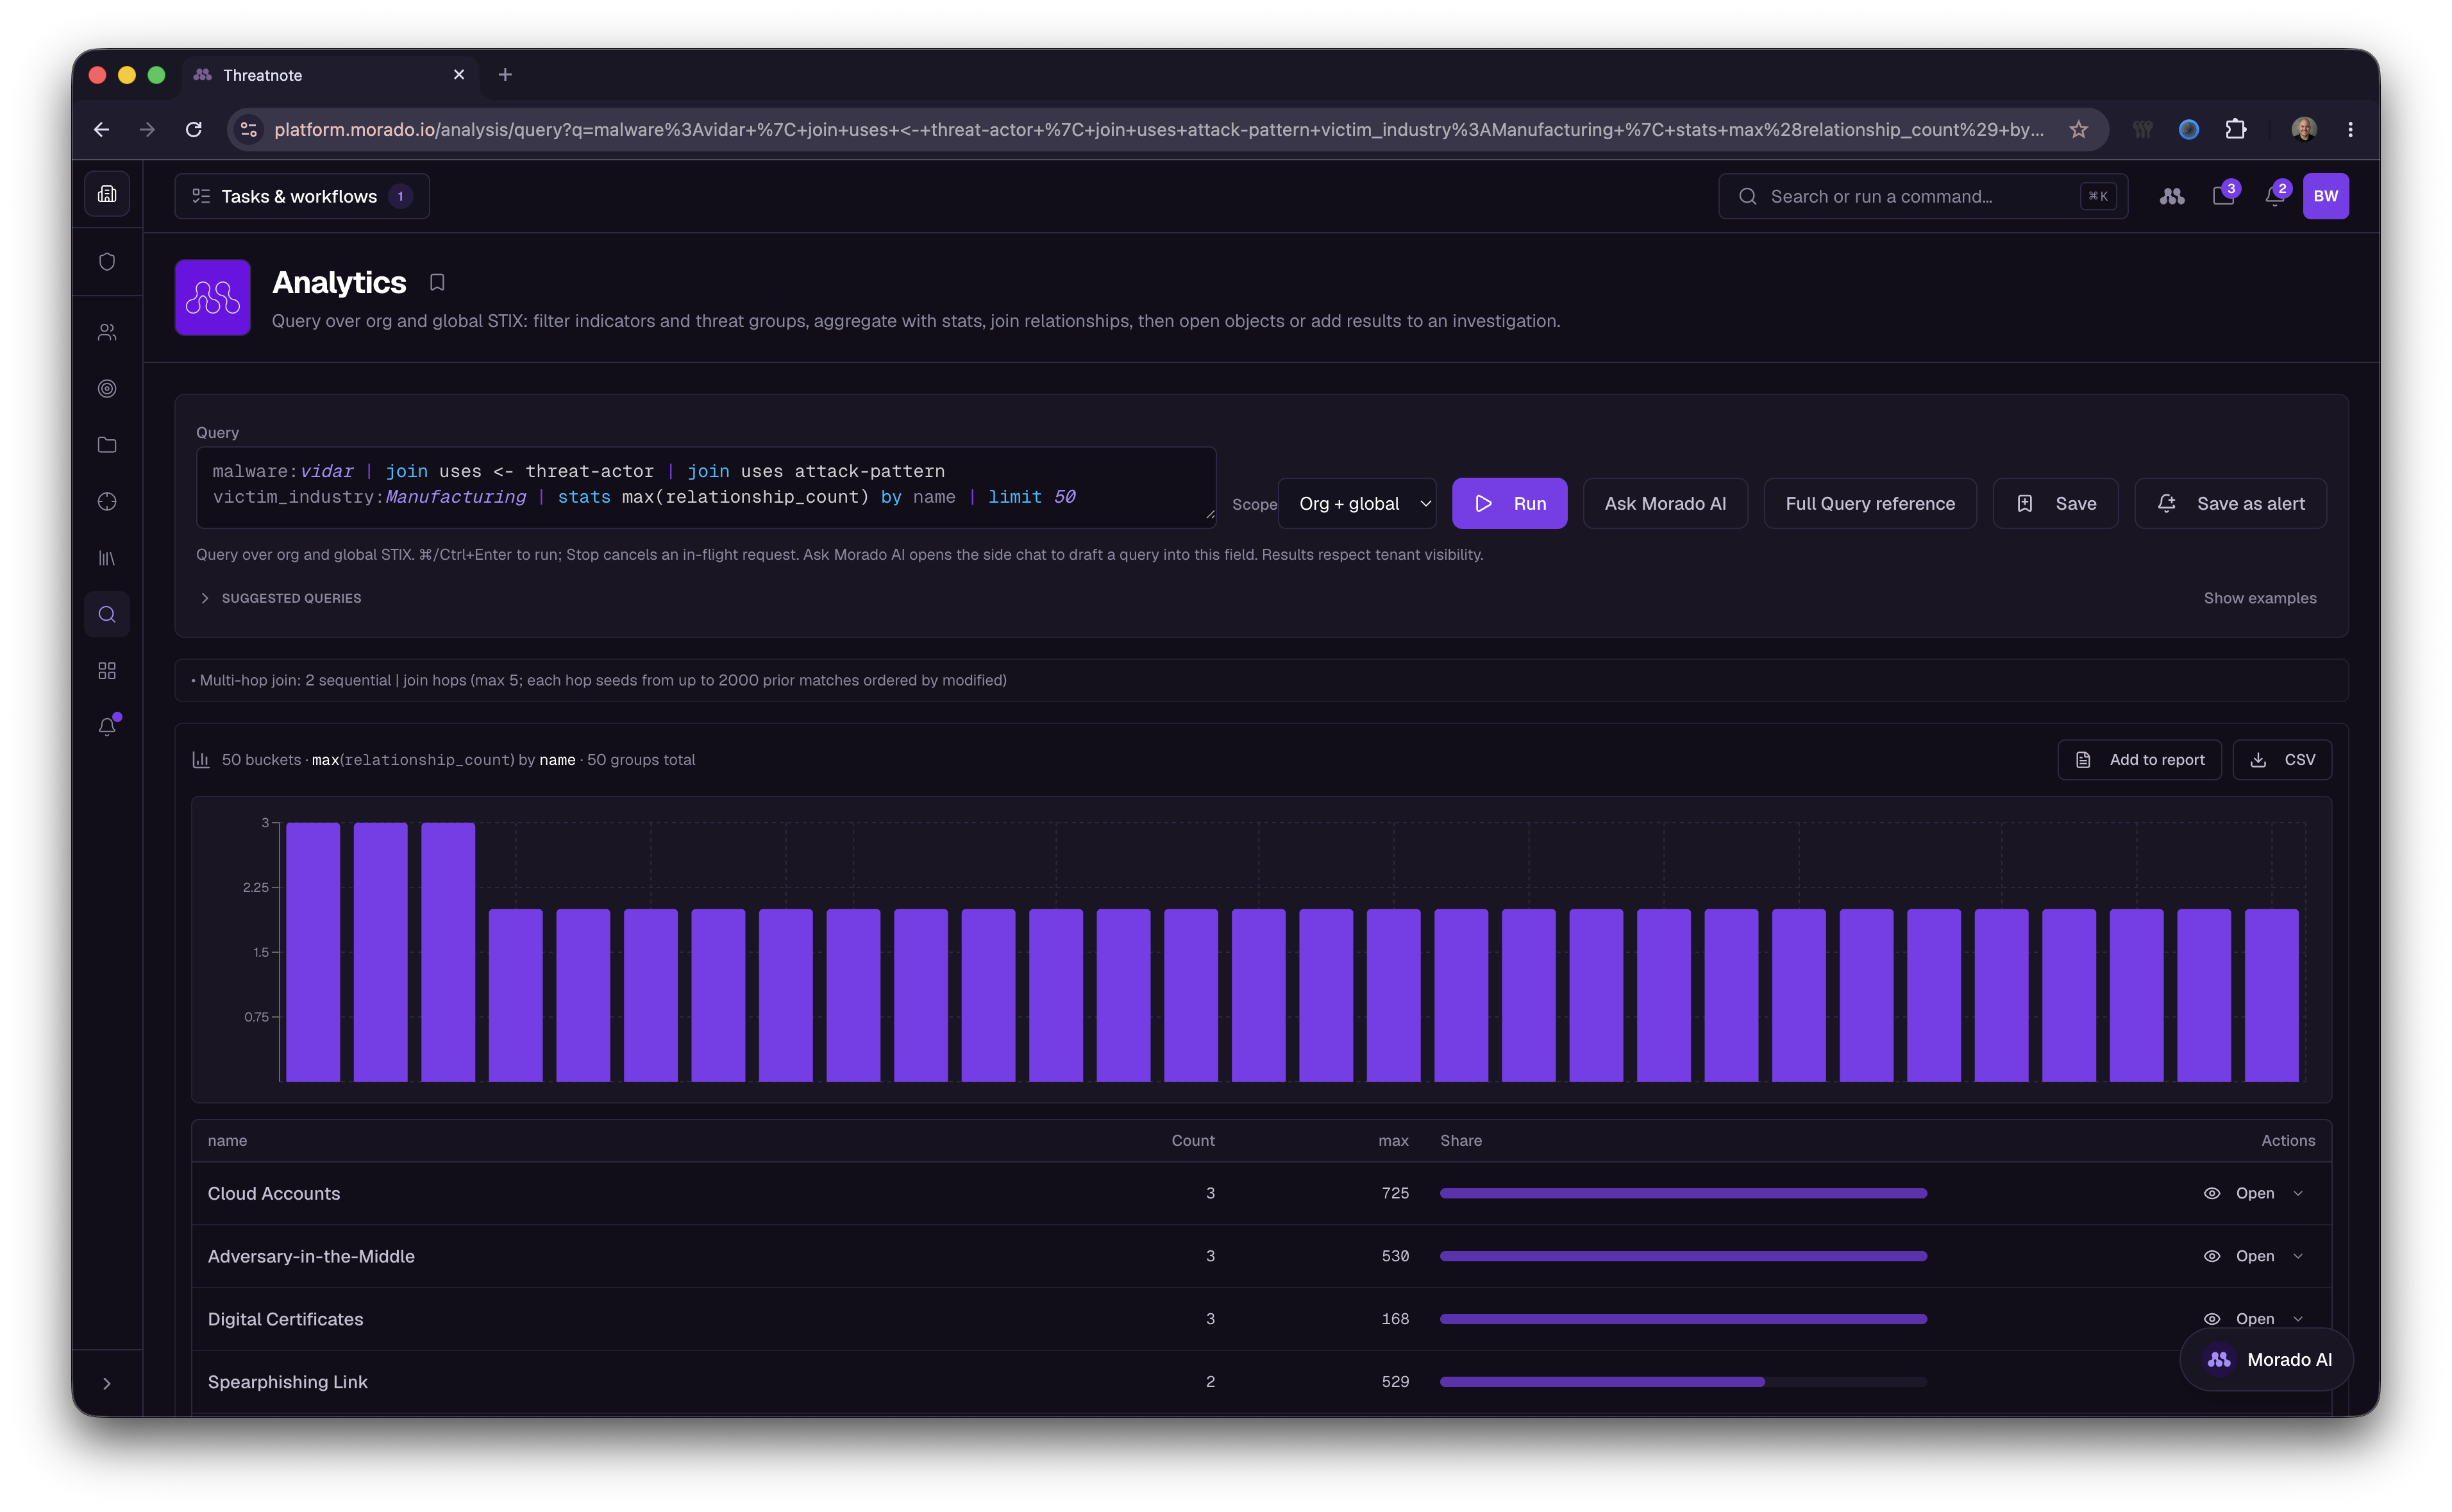
Or we could scope this to just attack-patterns that have been observed in our particular industry like Manufacturing
Once we’ve identified the attack patterns we’re interested in, clicking on a result will open the detail drawer on the right side providing context and information about that particular TTP.
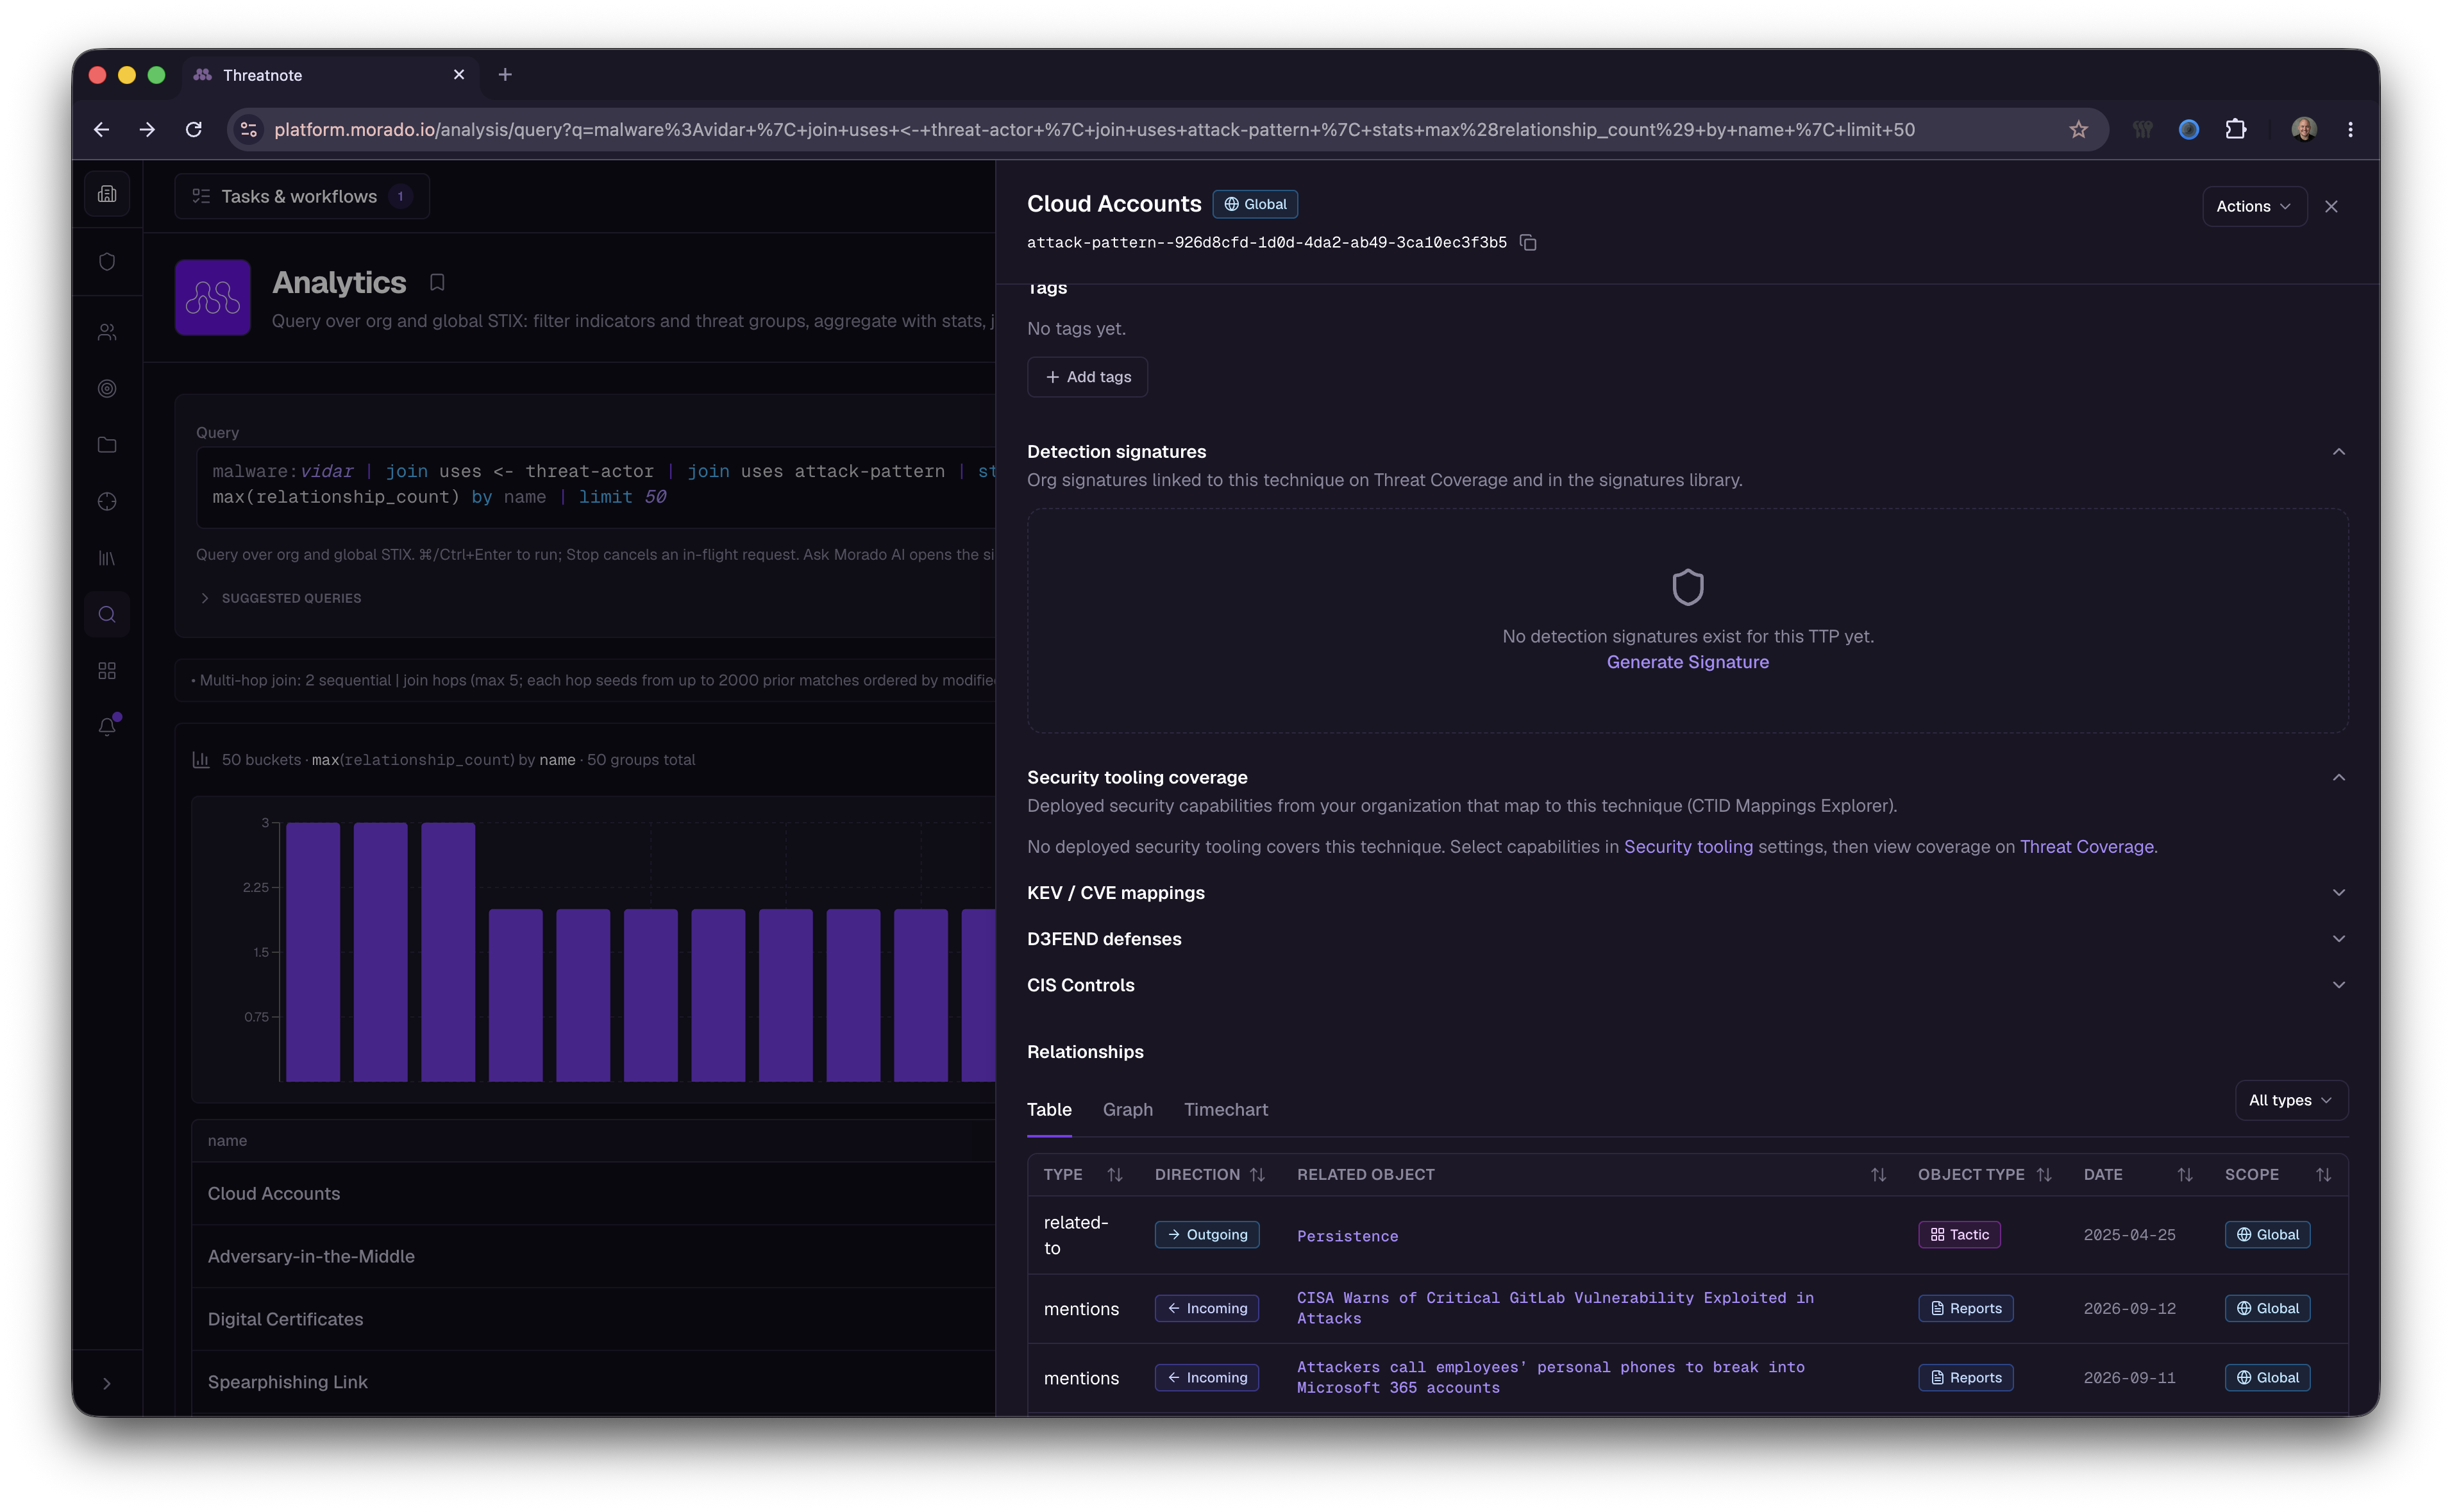
We can confirm we have no existing detection coverage for this TTP by looking at the available detection signatures or deployed security tooling that can detect, prevent, or mitigate these threats.
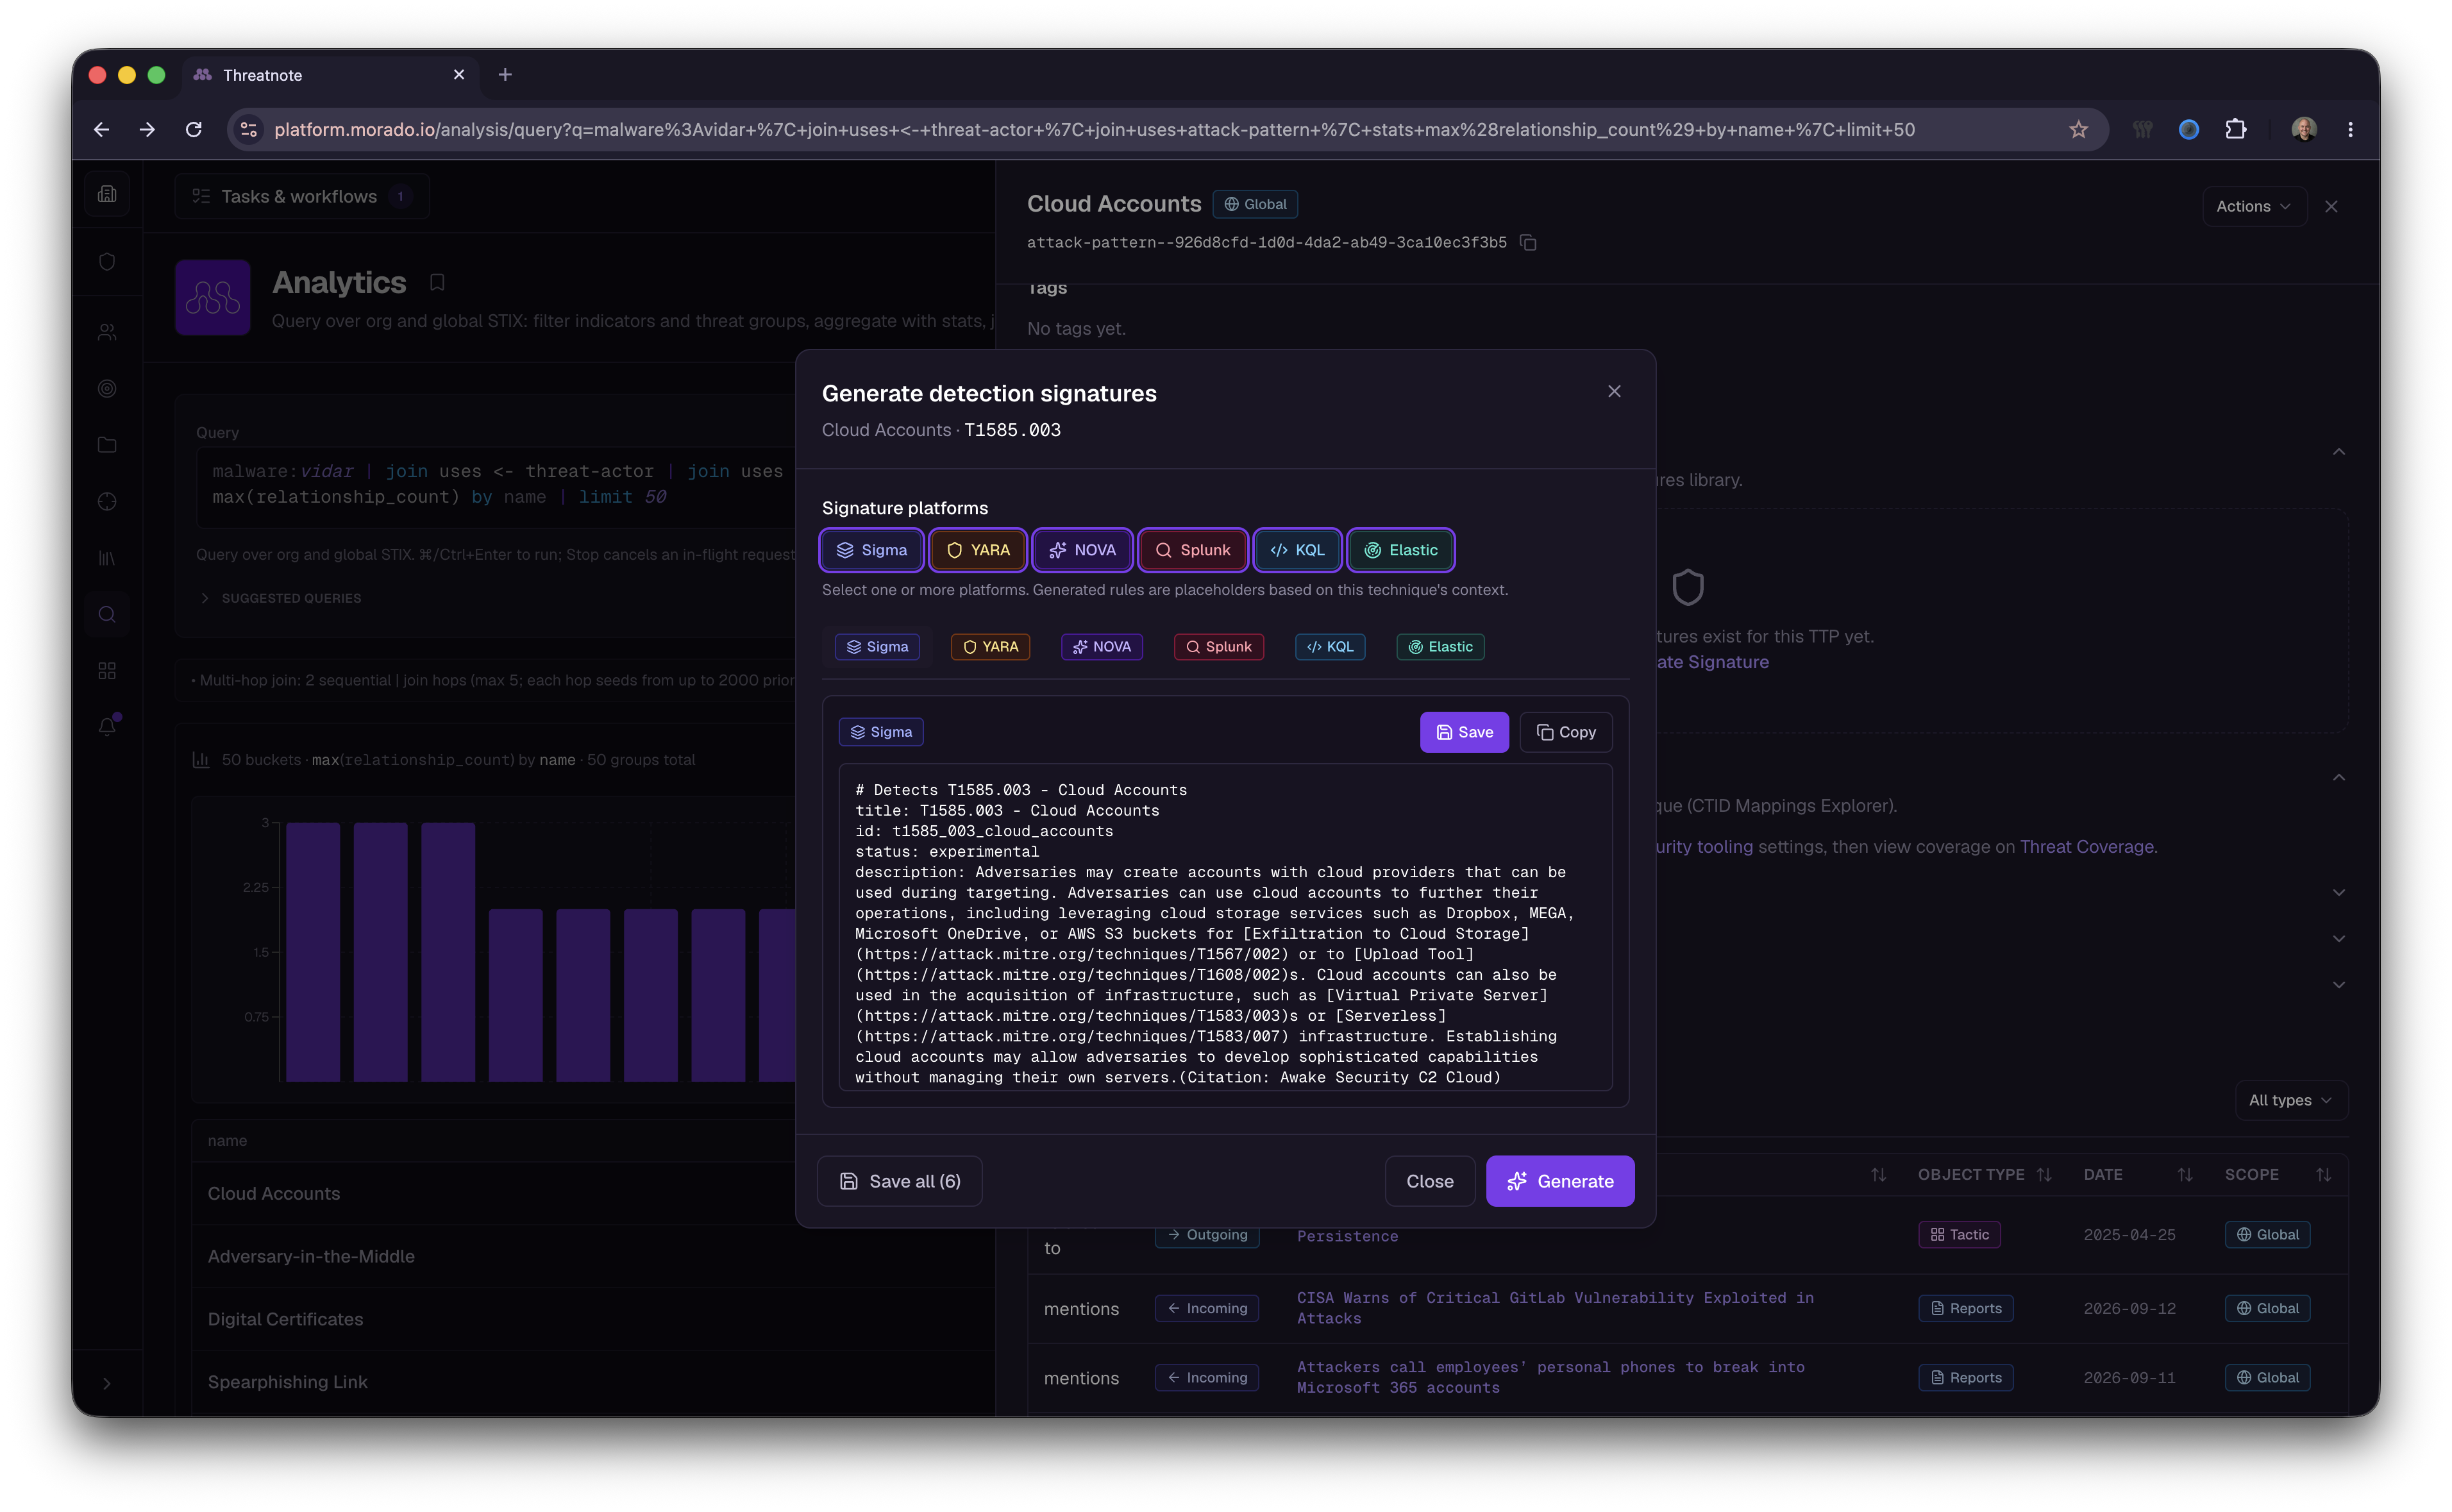
It’s pretty easy from that point to create detection signatures for a variety of different platforms, like Splunk, KQL, Elastic, YARA, Sigma, etc. We are utilizing our Morado AI to help us generate these signatures based off their descriptions and available data, and can easily save these to our platform if they are sufficient enough for our use case. From there, we can also deploy these signatures to said solutions as well, going from zero coverage to having at least a basic detection capability for these behaviors in minutes.
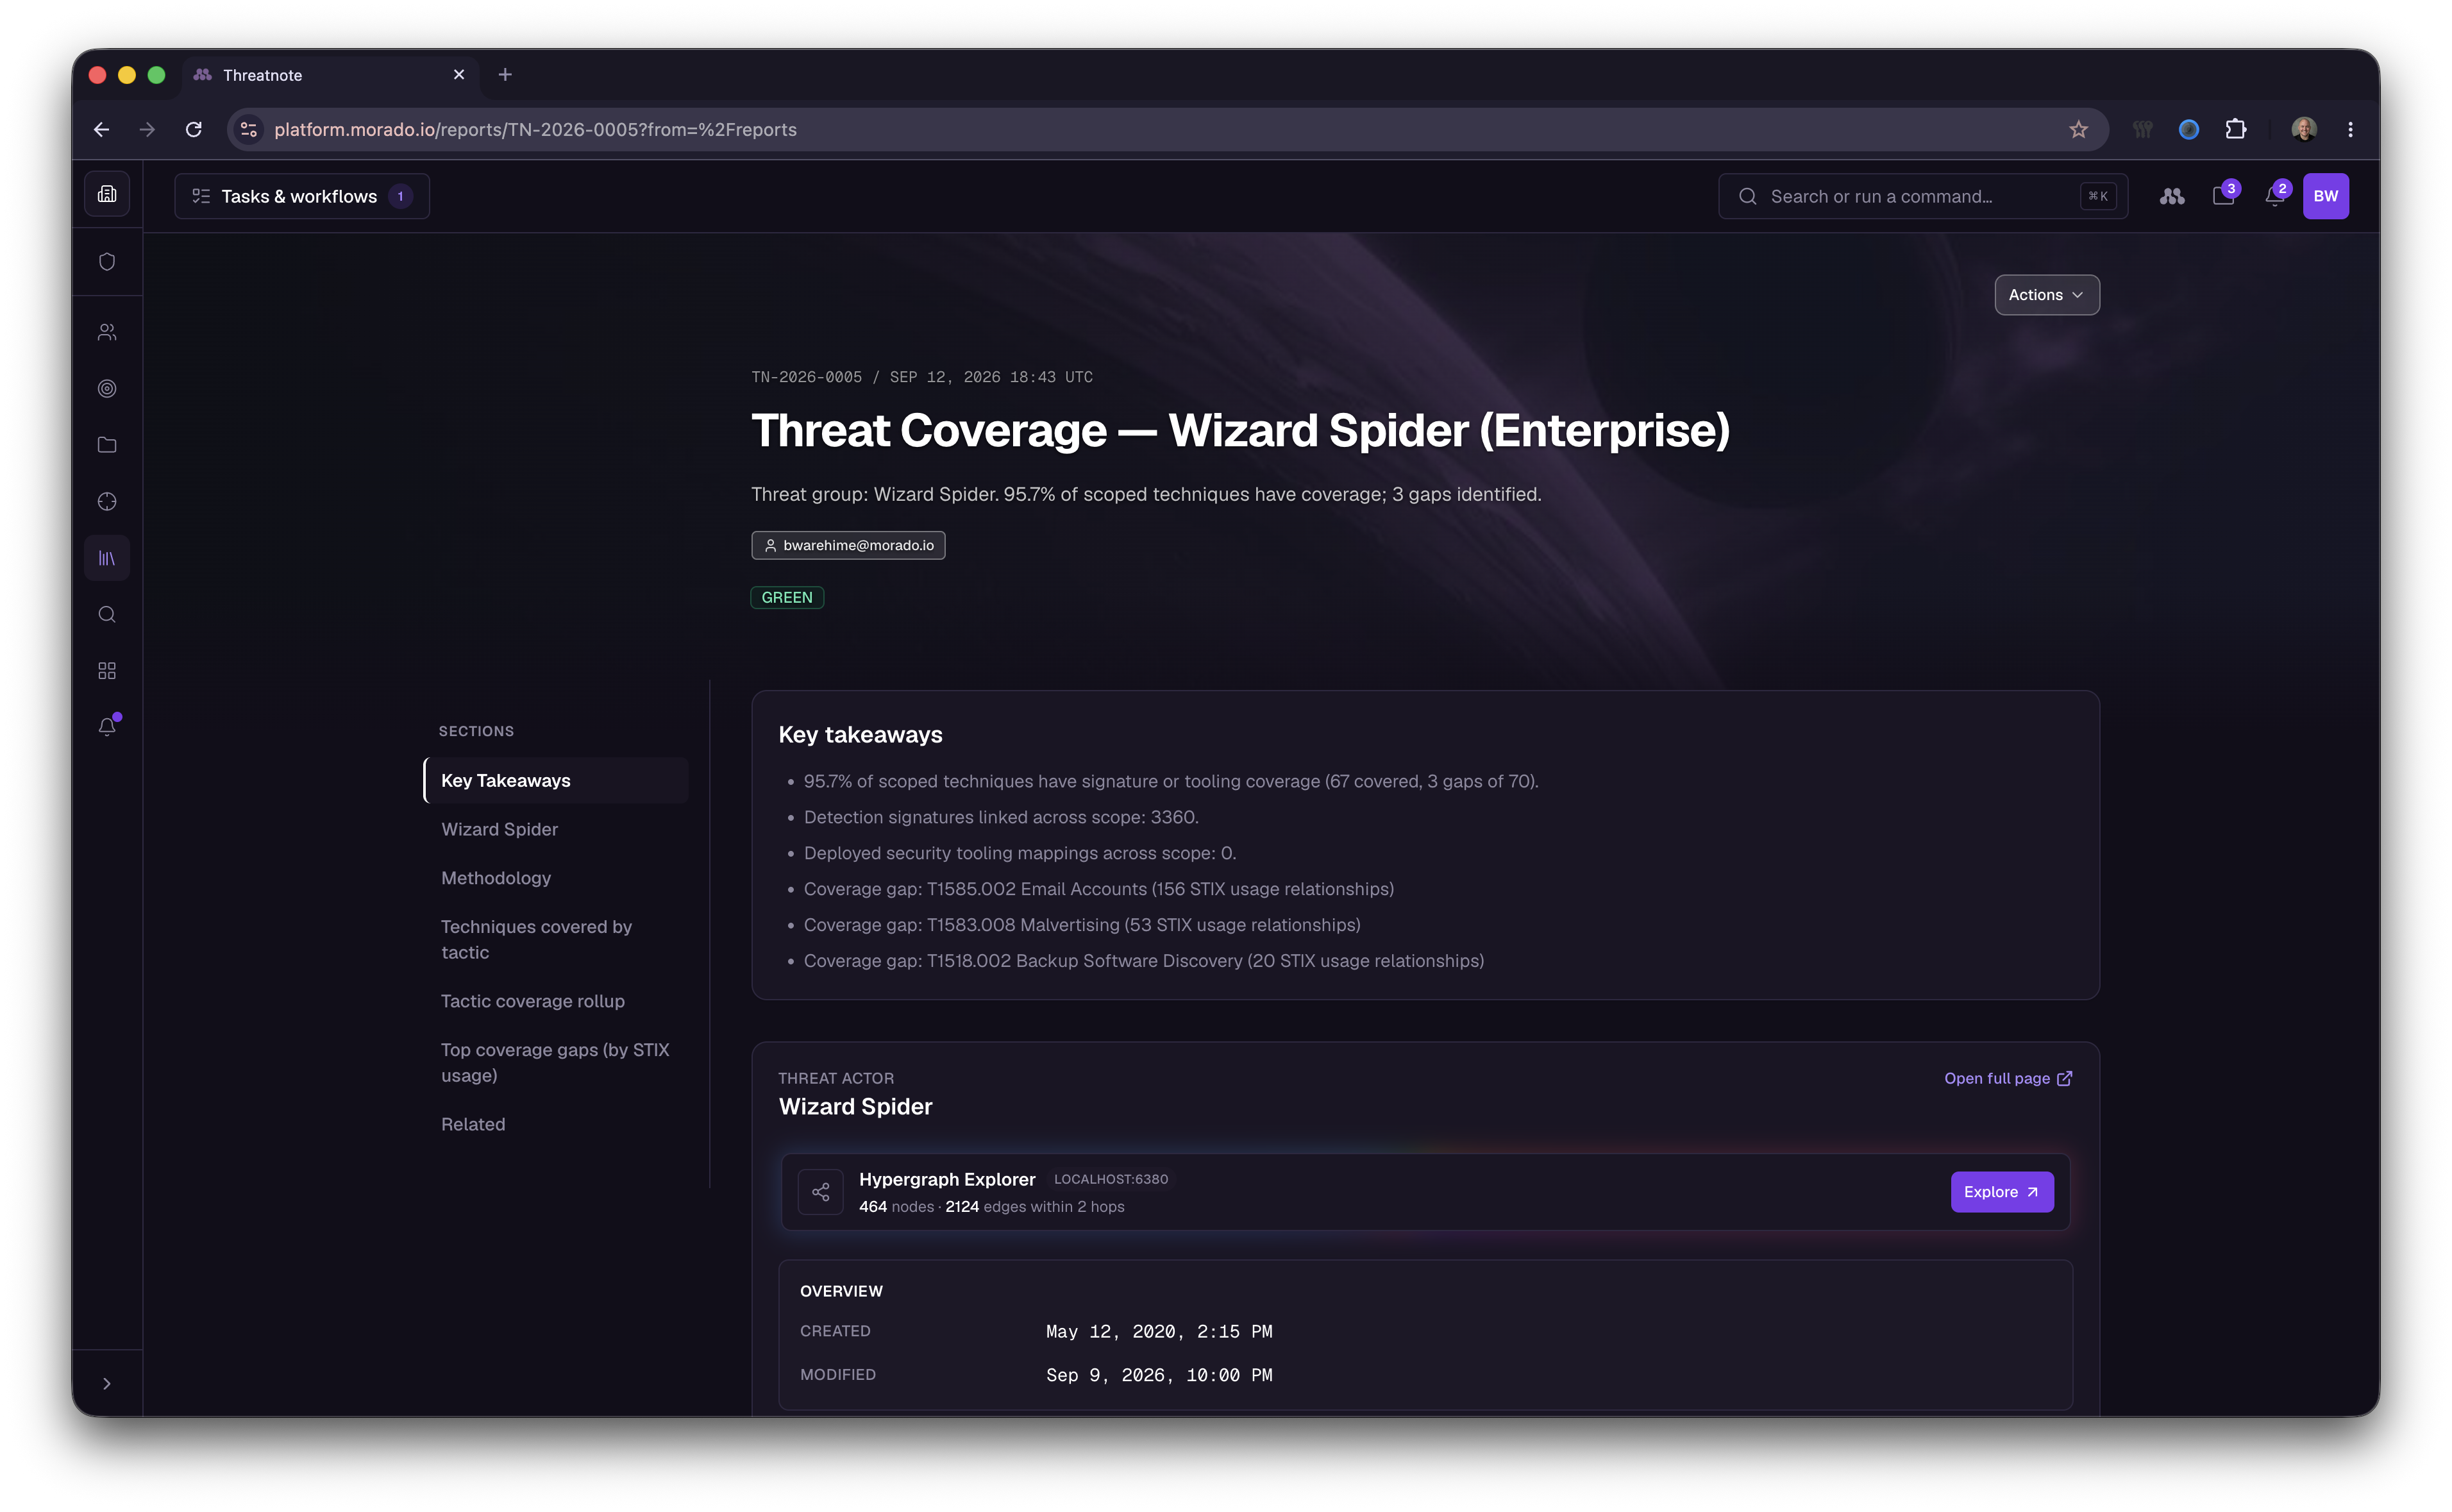
As I said before, there’s plenty of ways to slice and dice information in our platform, so I wanted to provide another feature that can help you through this process of prioritizing detection engineering efforts. Below we are using our Threat Coverage module, which allows users the ability to compare their security posture against industry frameworks like MITRE ATT&CK, OWASP, NIST, and more.
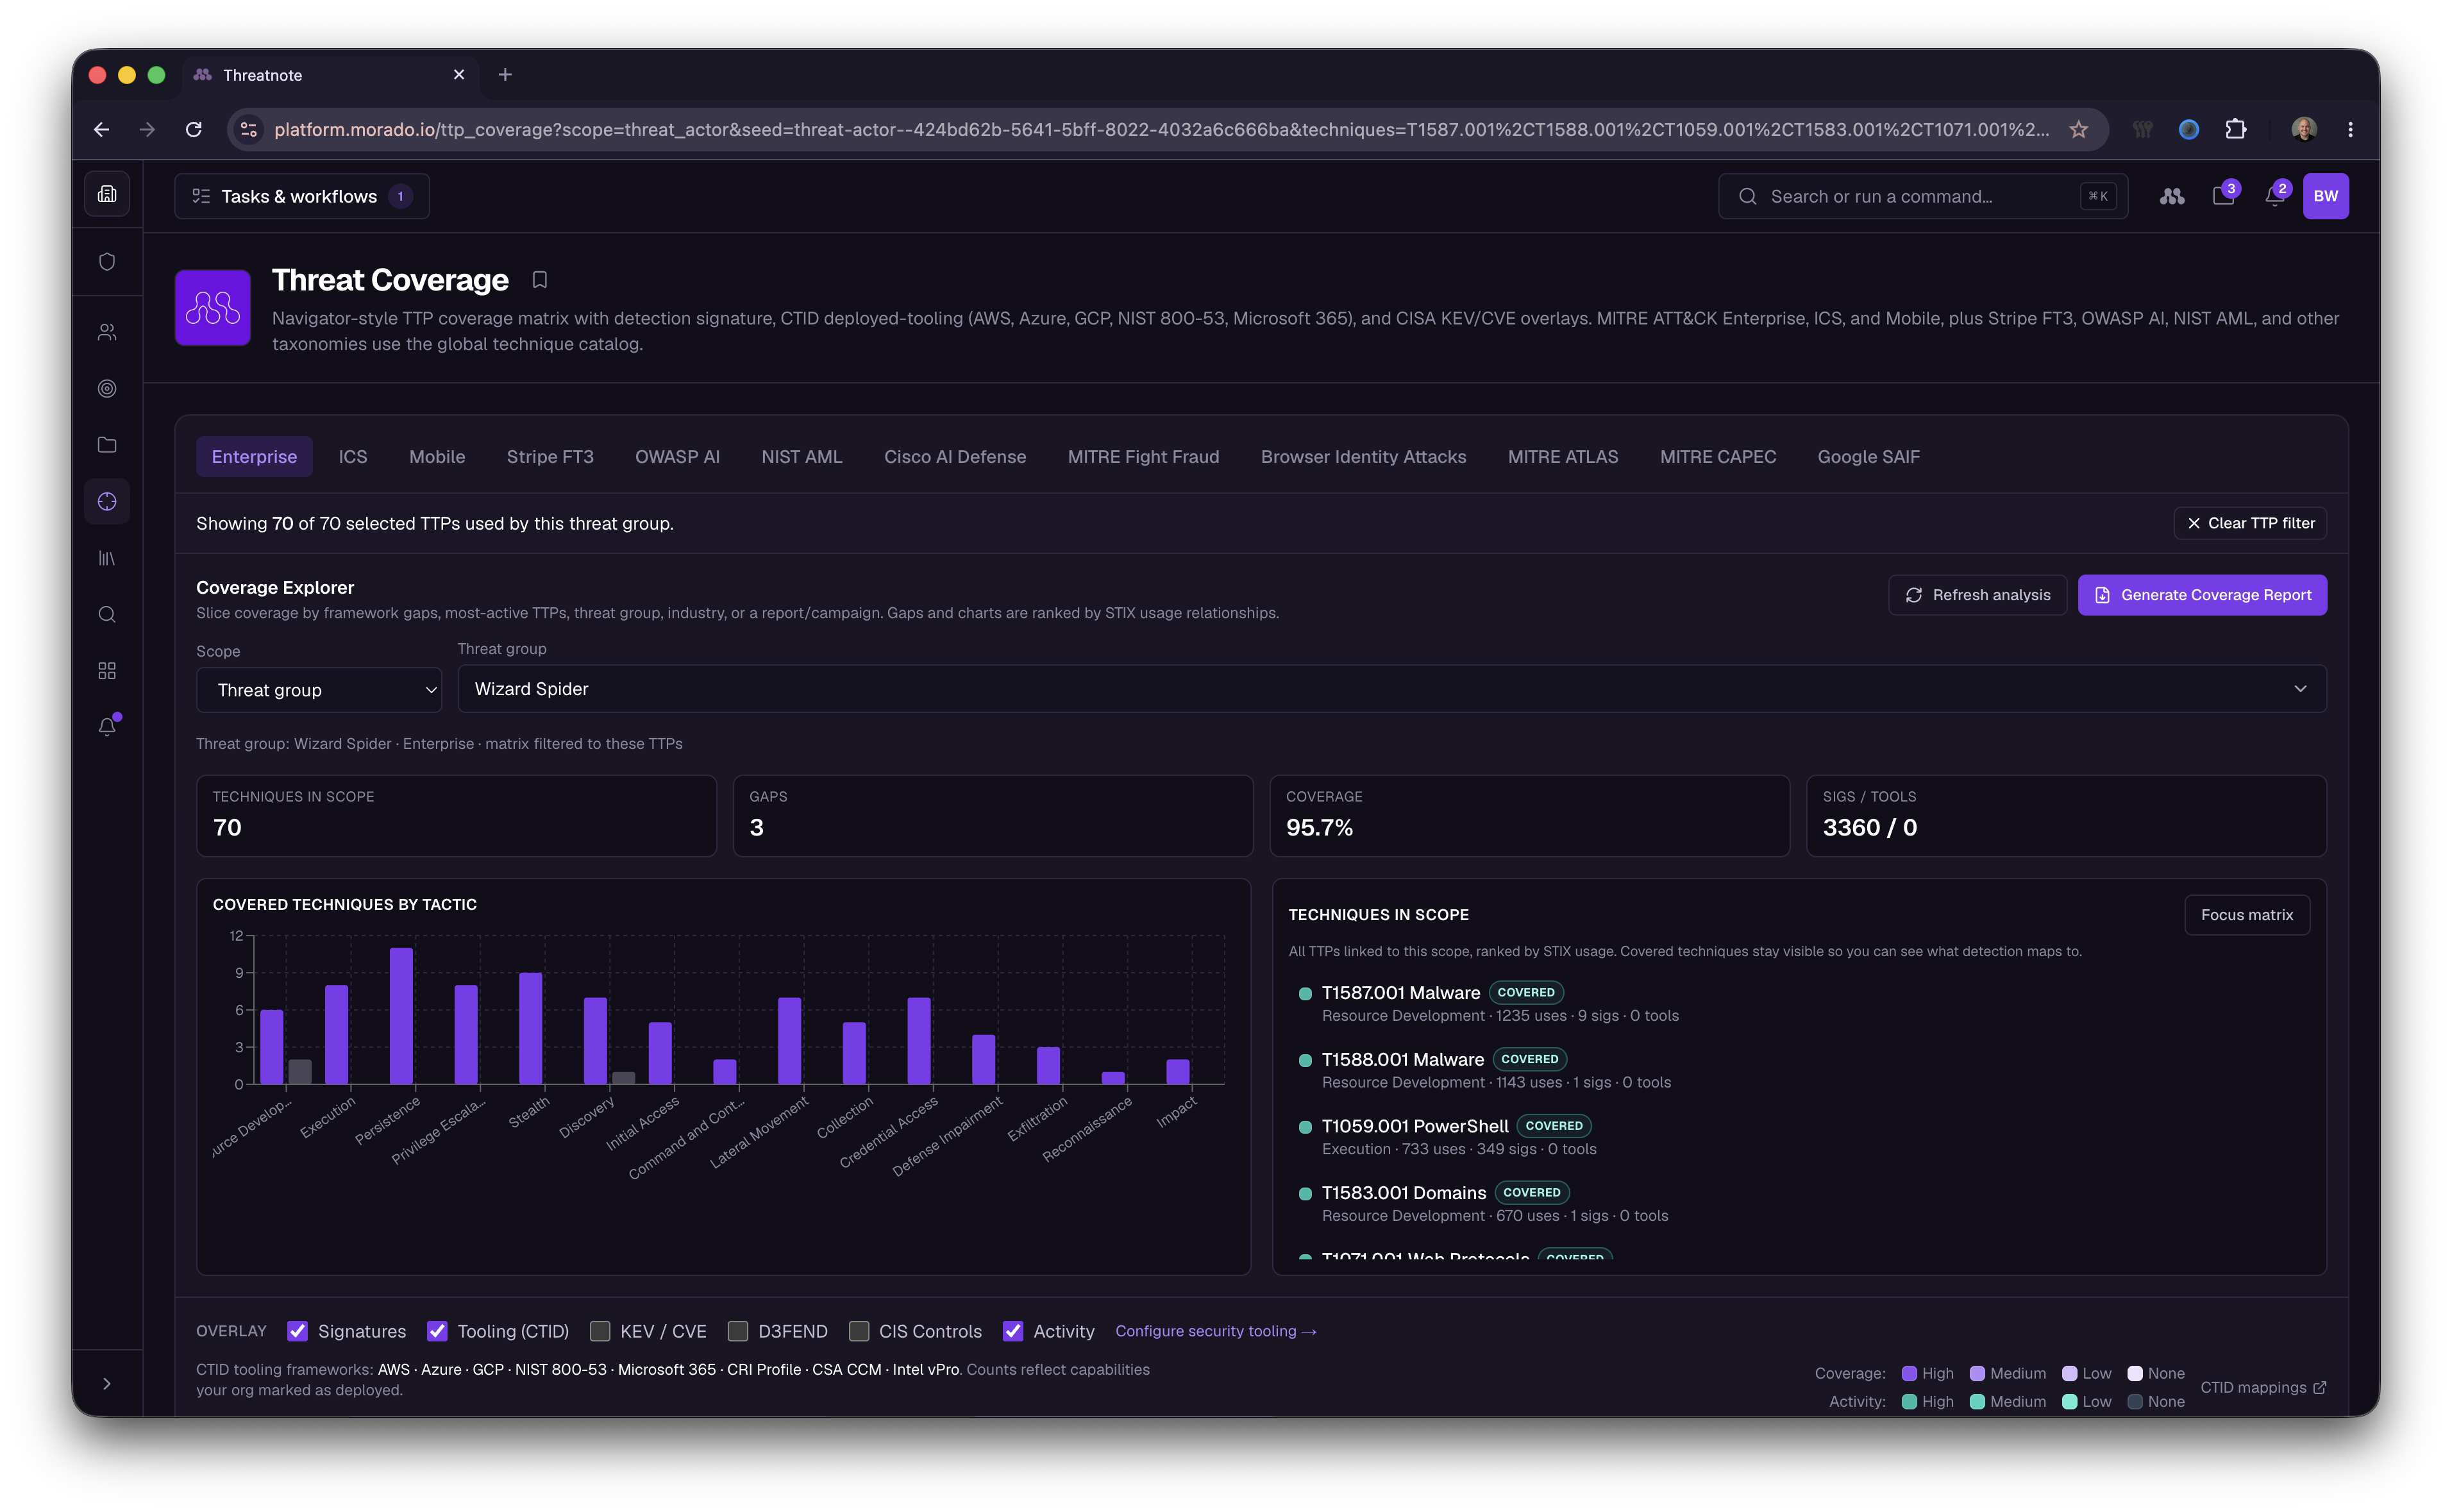
What’s pretty neat in here though is we can compare our existing coverage against a particular Threat Actor, a particular report discussing actor activity, industry trends, or down to a particular campaign. This helps quickly identify those gaps and allows you to perform your analysis on these TTP’s.
In addition, we can generate a coverage report based on whatever constraints we are working with. A CISO comes in and asks how we would have faired against a similar intrusion for a peer organization that was recently compromised, or how we stack up against what ShinyHunters are doing to other orgs, well, now we can easily generate these reports to provide peace of mind where needed, as well as prioritized remediation strategies for gaps.